
What Is Bitcoin Death Cross?
Comprehensive Guide to Bitcoin Death Cross: Understanding the Bearish Signal and Market Implications!
By reading the article “What Is Bitcoin Death Cross?” published in Adaas Investment Magazine, you will get acquainted with the Death Cross term in the technical analysis and what are the usages of Bitcoin Death Cross in general. This level of familiarity can be enough when you need educational information about this topic.
The podcast is published for you!

Table of Contents
Bitcoin death cross
With the increasing popularity of the cryptocurrency market, many users have sought out financial market analysts to manage their investment positions according to their suggestions.
Many users may have encountered the term Death Cross for Bitcoin while reading these analyses, and if their technical analysis knowledge is not at a professional level, they will not understand the meaning of this phrase and the strategy of the analysis being studied.
Simply put, in assets price technical analysis, when a short time moving average indicator, such as 30 to 50 days, cuts a long-term moving average price indicator over a period of 100 or 200 days in the uptrend market from top to bottom, We encounter the concept of the death cross.
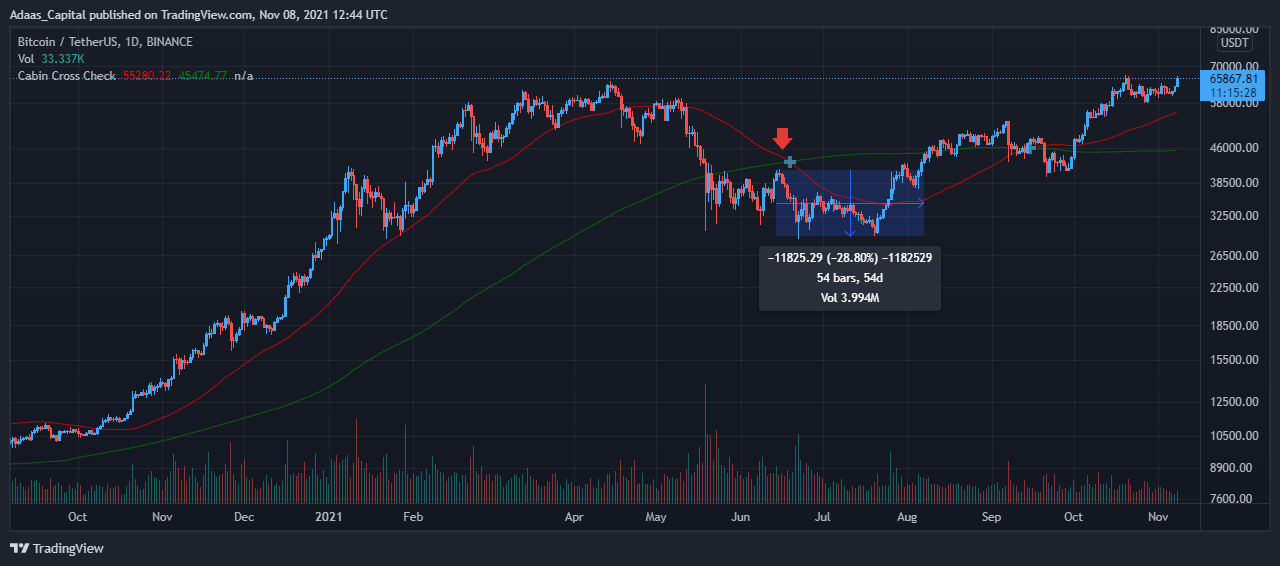
An example to better understand the Bitcoin death cross
As you can see in the image below, on June 17, 2021, the 50-day moving average indicator from the top cut off the 200-day moving average indicator at the $40,000 price level. After this intersection, we saw a 29% drop in the price of Bitcoin for nearly 2 months.
When does the Bitcoin death cross occur?
Now that we are familiar with the concept of the Death Cross analytics strategy, it is time to look at how this happens in financial markets.
Simply put, when the Death Cross appears in the price chart, it indicates a large sales volume and thus an increase in supply and a price decrease. The shape of this pattern is similar to the English letter X and can be clearly seen at a glance on any price chart.
Thus, when the volume of sales trades in a short period of time, such as a day, increases significantly, it causes fear in traders and investors, and this fear increases the supply of that asset in the market and causes The formation of the analytical pattern of the Death Cross in the price chart.

History of the Death Cross Pattern
As you have read, it is important when the Death Cross pattern appears on the price chart. Before the collapse of the financial markets between 1929 and 2021, many analysts reported the emergence of the Death Cross pattern in the price chart of important indicators such as the S&P 500 in the US stock market.
The Great Crash
One of the biggest falls since the Death Cross pattern appeared on the price chart was June 19, 1930, and the S&P 500, which fell 78%.
Also on December 19, 2007, after the death intersection pattern appeared, the S&P 500 index fell 53% for 2 years.

Surprise! Prices rose.
For example, in the summer of 2016, after the market downturn signal appeared, with the completion of the Death Cross pattern in the chart, many investors left the market, missing a unique opportunity to make a great profit until 2017.
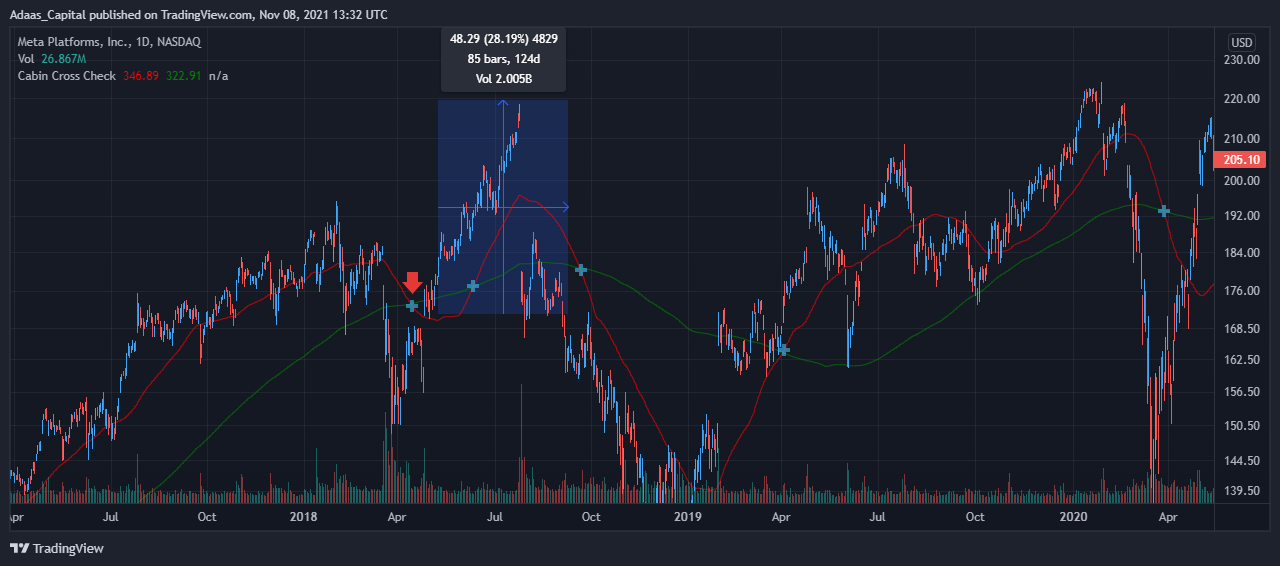
In the image below, you can see the stock price chart of Facebook, which has recently changed its name to META. As it is known to you, on April 12, 2018, the pattern of Death Cross appeared, but after that, this stock experienced a growth of 28%!
Use the Death Cross template for Bitcoin trades (ONLY EDUCATIONAL PURPOSES!)
Many analysts and investors, when opening a new investment position or managing their current positions, examine the Death Cross pattern and change their decisions according to its circumstances.
But if you are a professional trader or investor in the financial markets, you always know that a single factor can never be the deciding factor in the financial market.
Imagine a situation where at the same time as the pattern of Death Cross appears in the Bitcoin price chart, Announce the acceptance of Bitcoin as a currency in a powerful country or an update like Taproot for this cryptocurrency.
What is your decision? Are you a Bitcoin seller or buyer? The best strategy for you is when you understand how this analytical pattern works. First of all, you should not forget that the Death Cross pattern is used for long-term analysis, and conditions such as price support level or positive news for an asset can reduce the validity of this pattern!
What is the Golden Cross?
Simply put, the opposite of the Death Cross pattern, which represents a downward market, is the Golden Cross pattern, which encourages a bullish market for investors.
Exactly the opposite behavior with the Death Cross pattern causes the Golden Cross pattern to appear in the price chart. When in the bearish market, the 50-day moving average indicator cuts the 200-day moving average from the bottom of the indicator, indicating an increase in demand and consequently a price increase.

An example of a Golden Cross pattern in Bitcoin
In the image below, at the beginning of October 2021, the 50-day moving average indicator has cut the 200-day moving average from the bottom of the indicator, after which the price of Bitcoin cryptocurrency has experienced a 45% growth in 38 days.
The end words
At Adaas Capital, we hope that by reading this article you will be fully immersed in the Bitcoin Death Cross. You can help us improve by sharing this article which is published in Adaas Investment Magazine and help optimize this article by submitting your comments.

FAQ
What Is Bitcoin Death Cross?
When a short time moving average indicator, such as 30 to 50 days, cuts a long-term moving average price indicator over a period of 100 or 200 days in the uptrend market from top to bottom. , We encounter the concept of the death cross.
What Is Bitcoin Golden Cross?
Simply put, the opposite of the Death Cross pattern, which represents a downward market, is the Golden Cross pattern, which encourages a bullish market for investors.