
What Is Ethereum Rainbow Chart?
Comprehensive Guide to Ethereum Rainbow Chart: Understanding Its Meaning and Utilizing it for Analysis
By reading the article “What Is Ethereum Rainbow Chart?” published in Adaas Investment Magazine, you will be fully familiar with a practical analysis tool for the Ethereum cryptocurrency and all aspects of its full review! This level of familiarity can be enough when you need educational information about this topic.
If you’re interested in investing in Ethereum, you may have heard of the Ethereum Rainbow Chart. This chart is a popular technical analysis tool that can help investors identify entry and exit points based on historical price patterns. Ethereum is a decentralized, open-source blockchain platform that enables developers to build decentralized applications and smart contracts. It was created in 2015 by Vitalik Buterin and has since grown to become the second-largest cryptocurrency by market capitalization after Bitcoin in February 2023!
While investing in Ethereum can be a lucrative opportunity, it can also be challenging to navigate the volatile and complex market. That’s where the Rainbow Chart comes in. This chart is based on the logarithmic growth curve of Ethereum’s historical price performance and is designed to help investors identify potential support and resistance levels. By using the Rainbow Chart, investors can gain insight into where Ethereum is currently trading in relation to historical patterns and potentially make more informed investment decisions.
In this article, we’ll explain what the Ethereum Rainbow Chart is, how it works, and how you can use it to make informed investment decisions. We’ll also discuss the factors that can affect Ethereum’s price, how they can impact the Rainbow Chart and the limitations and risks of using the chart for investing. By the end of this article, you’ll have a comprehensive understanding of the Ethereum Rainbow Chart and be better equipped to invest in Ethereum.

Table of Contents
Understanding the Ethereum Rainbow Chart
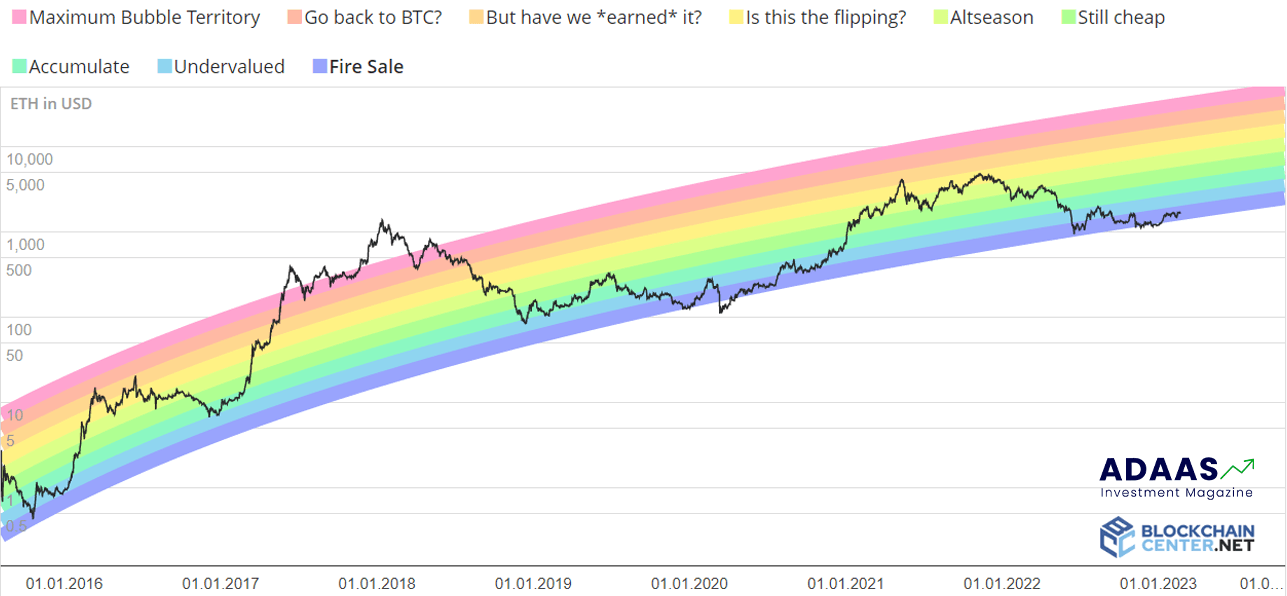
The Rainbow Chart is a graph that displays the logarithmic growth curve of Ethereum’s historical price performance in bands of different colors. These color bands represent different price ranges and can help investors identify where Ethereum is currently trading in relation to historical patterns. The Rainbow Chart consists of seven color bands, each of which represents a different percentage increase in price:
Black – Represents a 90% or more price drop from the all-time high.
Red – Represents an 80-90% price drop from the all-time high.
Orange – Represents a 70-80% price drop from the all-time high.
Yellow – Represents a 50-70% price drop from the all-time high.
Green – Represents a 30-50% price drop from the all-time high.
Blue – Represents a 10-30% price drop from the all-time high.
Violet – Represents a price within 10% of the all-time high.
The Rainbow Chart is based on historical data, and its purpose is to help investors identify potential support and resistance levels. Support levels are prices at which the chart indicates that Ethereum is undervalued and may be a good time to buy. Resistance levels are prices at which the chart shows that Ethereum is overvalued and may be a good time to sell.
The Rainbow Chart has been used by traders and investors to help guide their investment decisions, but it’s important to remember that past performance is not indicative of future results. It’s also important to use the chart in context with other factors, such as market sentiment and fundamental analysis when making investment decisions. By combining technical analysis with a sound investment strategy, investors can potentially make more informed decisions about investing in Ethereum.
Warning! This article is only published for educational reasons and we do not offer, persuade or suggest any analytical tools for your investment decisions.
How to Use the Ethereum Rainbow Chart for Investing
The Rainbow Chart can be a valuable tool for investors who are looking to buy or sell Ethereum. By analyzing the Rainbow Chart, investors can identify potential support and resistance levels and use this information to make informed investment decisions. Here are the steps you can take to use the Rainbow Chart for investing:
Review the Rainbow Chart: Take a close look at the Rainbow Chart and pay attention to where Ethereum is currently trading in relation to the different color bands. The chart will help you identify which color band Ethereum is currently in and whether it is in a buying zone, selling zone, or somewhere in between.
Determine the Price Range: Once you’ve identified the color band that Ethereum is in, determine the price range associated with that color band. This will give you an idea of the price range at which Ethereum is currently trading and whether it’s a good time to buy or sell.
Monitor the Market: Keep an eye on the market to see if any significant news or events occur that could affect Ethereum’s price. For example, news of a major partnership or regulatory change could have a significant impact on Ethereum’s price and could cause it to move out of its current color band.
Use Other Technical Analysis Tools: In addition to the Rainbow Chart, use other technical analysis tools such as moving averages, volume indicators, and oscillators to confirm your investment decision. Combining multiple technical analysis tools can help you make more informed investment decisions.
Create a Sound Investment Strategy: It’s important to have a sound investment strategy in place when investing in Ethereum or any other cryptocurrency. This includes diversifying your portfolio, setting stop-loss orders, and having a long-term investment horizon.
It’s important to note that the Rainbow Chart is just one tool in your analysis toolkit and should not be the sole basis for your investment decisions. The chart is based on historical data, and past performance is not indicative of future results. It’s also important to use the chart in conjunction with other fundamental and technical analysis tools to make informed investment decisions.

Factors Affecting Ethereum Price & How They Affect the Rainbow Chart
The price of Ethereum, like any other cryptocurrency, is affected by a variety of factors. These factors can have a significant impact on the price of Ethereum and can cause it to move out of its current color band on the Rainbow Chart. Here are some of the factors that can affect Ethereum’s price:
Market Sentiment: Market sentiment plays a major role in determining the price of Ethereum. Positive news and sentiment can cause the price of Ethereum to rise, while negative news and sentiment can cause it to fall.
Adoption: The adoption of Ethereum by individuals, institutions, and governments can have a significant impact on its price. As more people and entities adopt Ethereum, its demand and value can increase.
Competition: Ethereum faces competition from other cryptocurrencies and blockchain platforms. The emergence of new technologies and platforms can impact Ethereum’s price by affecting its adoption and perceived value.
Regulatory Environment: The regulatory environment for cryptocurrencies can have a significant impact on their price. Regulations that are perceived as positive or favorable to the cryptocurrency industry can cause the price of Ethereum to rise, while negative regulations can cause it to fall.
Technical Developments: Technical developments such as upgrades, bug fixes, and new features can impact the price of Ethereum. These developments can increase the demand for Ethereum and its perceived value.
All of these factors can affect the price and cause it to move out of its current color band on the Rainbow Chart. For example, if positive news or sentiment emerges, Ethereum’s price may rise and move out of the green or blue color band and into the yellow or orange color band. Conversely, if negative news or sentiment emerges, Ethereum’s price may fall and move out of the yellow or orange color band and into the red or black color band.
It’s important to keep these factors in mind when using the Rainbow Chart for investing in Ethereum. While the Rainbow Chart can help identify potential support and resistance levels, it’s important to monitor the market and stay aware of any significant news or events that could impact Ethereum’s price. By combining the Rainbow Chart with other technical and fundamental analysis tools, investors can make more informed investment decisions.

Limitations and Risks of Using the Ethereum Rainbow Chart for Investing
While the Ethereum Rainbow Chart can be a useful tool for identifying potential support and resistance levels and making investment decisions, there are several limitations and risks that investors should be aware of.
Historical Data: The Rainbow Chart is based on historical price data, and as such, it may not accurately predict future price movements. There are a variety of factors that can impact Ethereum’s price, and these factors may not have been present in the historical data used to create the chart.
Volatility: Cryptocurrencies are known for their high levels of volatility, and Ethereum is no exception. The price of Ethereum can move quickly and dramatically, and the Rainbow Chart may not be able to keep up with these rapid price movements.
False Signals: The Rainbow Chart is a technical analysis tool, and like all technical analysis tools, it is not infallible. There may be times when the Rainbow Chart generates false signals or fails to accurately predict price movements.
Market Manipulation: The cryptocurrency market is largely unregulated, which means that market manipulation can occur. Market manipulation can distort the price of Ethereum and invalidate the signals generated by the Rainbow Chart.
External Factors: As mentioned earlier, there are a variety of external factors that can impact the price of Ethereum. These factors can include everything from government regulations to macroeconomic trends, and they can be difficult to predict or account for.
It’s important for investors to be aware of these limitations and risks when using the Rainbow Chart for investing in Ethereum. The Rainbow Chart should not be used in isolation, but rather as part of a larger technical and fundamental analysis toolkit. Investors should also keep an eye on the market and stay informed about any significant news or events that could impact Ethereum’s price.

Conclusion
The Rainbow Chart is a powerful tool that can help investors make informed investment decisions. By identifying potential support and resistance levels, the Rainbow Chart can provide valuable insights into Ethereum’s price movements and help investors make more informed buying and selling decisions.
However, it’s important to keep in mind the limitations and risks of using the Rainbow Chart for investing. The chart is based on historical data and may not accurately predict future price movements. It’s also important to monitor the market and stay informed about any external factors that may impact Ethereum’s price.
Ultimately, the Rainbow Chart should be used as part of a larger technical and fundamental analysis toolkit. By combining the Rainbow Chart with other analysis tools, investors can make more informed investment decisions and increase their chances of success in the cryptocurrency market.
It’s also important for investors to remember that the cryptocurrency market is highly volatile and can be subject to market manipulation. As such, it’s important to practice responsible investing and avoid making emotional decisions based on short-term price movements.
In summary, the Ethereum Rainbow Chart is a valuable tool that can provide valuable insights into Ethereum’s price movements. By using the chart in combination with other analysis tools and staying informed about market trends and news, investors can make more informed investment decisions and increase their chances of success in the cryptocurrency market.

The End Words
At Adaas Capital, we hope that by reading this article you will be fully immersed in What is Ethereum Rainbow Chart and How To Use It For Your Investments! You can help us improve by sharing this post which is published in Adaas Investment Magazine and help optimize it by submitting your comments.
FAQ
What is a rainbow chart Crypto?
A rainbow chart is a visual representation of the historical price movements of a cryptocurrency over time, typically plotted in a rainbow color spectrum. It is often used as a tool for technical analysis to identify potential support and resistance levels.
What is the difference between Bitcoin rainbow chart and stock to flow?
The Bitcoin Rainbow Chart and Stock-to-Flow (S2F) model are both tools used for technical analysis in the cryptocurrency market, but they are different in their approach. The Rainbow Chart is based on historical price data and is used to identify potential support and resistance levels. The S2F model, on the other hand, uses a mathematical formula based on the scarcity of Bitcoin to predict future price movements.
Is the Ethereum rainbow chart accurate?
The accuracy of the Ethereum Rainbow Chart depends on various factors, such as the quality and completeness of the historical data used, market conditions, and external factors affecting the price of Ethereum. While the Rainbow Chart can provide useful insights into potential support and resistance levels, it should not be used as the sole basis for investment decisions.